
Crude spikes 2.7% on fresh Iran strikes; gold extends slide to −$74 ahead of PCE data
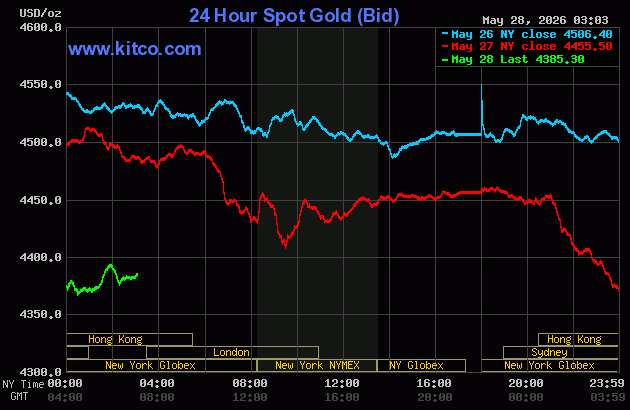
WTI crude surged 2.7% to $91/bbl after fresh U.S. airstrikes on Iran overnight reversed Wednesday's peace-trade optimism. Gold fell another $74 (−1.66%) to $4,381, extending its week-long slide as the Hormuz ceasefire held. Today's 8:30 AM ET PCE print is the next critical risk event for gold and the dollar. Copper slipped 0.43% on China demand concerns; iron ore held flat at $109.27; corn edged up 0.58%.

Commodities Daily Move — May 28, 2026
Pre-market briefing as of 07:00 UTC | All prices live/near-live
At a glance
| Commodity | Price | Change |
|---|---|---|
| Gold (spot) | $4,381.50 / oz | ▼ −$74.00 (−1.66%) |
| WTI Crude | $91.08 / bbl | ▲ +$2.40 (+2.71%) |
| Brent Crude | $96.84 / bbl | ▲ +$2.55 (+2.70%) |
| Copper (front-month) | $6.3113 / lb | ▼ −0.43% |
| Iron Ore 62% Fe CFR | $109.27 / t | → flat (0.00%) |
| Corn (front-month) | 454.60 ¢/bu | ▲ +0.58% |
Gold: down again, and more pain possible this morning
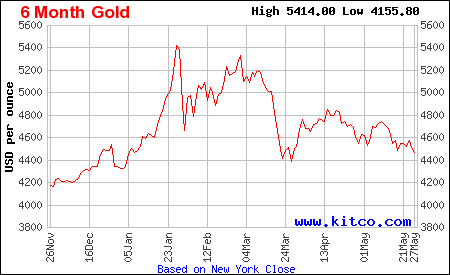
Gold shed another $74 overnight to $4,381.50 — a −1.66% drop that pushes it further into territory not seen since early May. Wednesday's Kitco AM report had it at $4,446 at the open; it's now down another $65 from that intraday read, a sign that Asian session sellers were in control. 4
The mechanism is still the same one that's been grinding the metal lower all week: the Strait of Hormuz ceasefire is holding. When the risk of a full regional oil-supply disruption recedes, so does gold's safe-haven premium. The Kitco morning note put it plainly: "a credible reopening path reduces the conflict premium." UBS last week cut its 2026 gold forecast from $5,900 to $5,500/oz, citing elevated U.S. Treasury yields and dollar strength as structural headwinds. The 10-year yield is sitting near 4.5%. 5
The bigger test comes at 8:30 AM ET. April PCE (the Fed's preferred inflation gauge), April personal income and spending, durable goods orders, and the second Q1 GDP estimate all print simultaneously. If PCE comes in above consensus, expect bond yields to rip higher and gold to extend the slide toward the $4,319 technical support flagged by Kitco's technical team. A softer print could offer a brief bounce toward resistance at $4,453–$4,484, but the structural headwind from U.S. rate expectations remains intact.
Relevant equities: Barrick Gold (GOLD), Newmont (NEM), Agnico Eagle (AEM), Kinross Gold (KGC). UBS's forecast cut and the dollar-strength narrative both argue for caution on unhedged gold miners; those with locked-in forward sales or diversified production profiles are better insulated.
Crude oil: strikes flip the trade
Oil did the opposite of gold overnight. WTI jumped to $91.08 (+2.71%) and Brent to $96.84 (+2.70%) after the U.S. military conducted fresh strikes on southern Iran — hitting a ground control station it said was preparing to launch a fifth attack drone — and shot down four Iranian drones in the process. 6

This came after Wednesday had been all about the other direction: oil dropped 4%+ on U.S.–Iran deal optimism, and gold took that as its cue to fall too. The overnight pivot puts the market back on alert. Trump's Wednesday comments complicated the deal picture further — he said the U.S. was in "no rush," ruled out sanctions relief or cash transfers, and threatened to "finish them off" if terms weren't met. Iranian ultra-hardliners simultaneously attacked the country's own negotiators for considering compromises.
The structural demand picture adds fuel to the price: the American Petroleum Institute reported U.S. crude inventories fell 2.8 million barrels in the week ending May 22 — the sixth straight weekly draw. EIA data (delayed one day by Monday's Memorial Day holiday) prints this morning and will either confirm or complicate that picture. 7
Breaking news from OilPrice.com this morning: three oil tankers and two gas carriers cleared the Strait of Hormuz overnight, consistent with the patchwork transit pattern that has developed since the crisis began. ADNOC previously sent a carrier through in "dark mode." 8
Key watch: ADNOC warned this week that Gulf oil disruptions could persist into 2027 if no durable agreement is reached. Until a signed deal reopens the strait reliably, each new round of U.S. strikes resets the oil risk premium.
Relevant equities: ExxonMobil (XOM), Chevron (CVX), ConocoPhillips (COP), Pioneer Natural Resources (PXD), Halliburton (HAL), Marathon Oil (MRO). Refiners and LNG operators (Cheniere Energy, LNG) remain in focus as the U.S. routes SPR cargoes to Asia to compensate for Hormuz disruption.
Copper: China headwinds push it lower
Copper edged down another 0.43% to $6.3113/lb. The proximate driver is demand-side skepticism around China: the Shanghai Composite fell 1.3% and the Hang Seng dropped 1.1% overnight, reflecting persistent concerns about China's credit cycle. Bank of America this week downgraded Rio Tinto and BHP from Buy to Neutral, citing "above-fair-value" pricing and a "negative China credit impulse." 2
The technical picture from yesterday (deeply negative sentiment indicators) has not reversed. Watch the PCE data: a soft number that eases dollar pressure could provide a short-term copper lift, while a hot print would amplify the current downward drift.
Relevant equities: Freeport-McMoRan (FCX), Southern Copper (SCCO), Rio Tinto (RIO), BHP Group (BHP — though now on BofA Neutral), Ivanhoe Mines (IVN).
Iron ore: flat, but the backdrop is cooling
Iron ore 62% Fe CFR settled at $109.27/t with no change from the prior close. The flat session masks a deteriorating demand backdrop: BofA's downgrades of Rio Tinto and BHP explicitly cited the China credit impulse as negative for base metals. Barclays separately noted that mining equities are currently priced at a discount to spot commodity levels, which could mean market makers are anticipating softness ahead rather than current prices. 9
The 52-week range is $93.41–$111.42, so at $109.27 the market is near the upper end; the risk asymmetry favors a drift toward the midpoint if China data disappoints. Fortescue (FMG) is maintaining its shipment guidance, and Rio completed its 8 billionth tonne of Pilbara shipment this month — a milestone, but not a price catalyst.
Relevant equities: Rio Tinto (RIO), BHP Group (BHP), Fortescue Metals (FMG), Vale (VALE).
Corn: modest bounce, no fresh catalyst
Corn front-month climbed 0.58% to 454.60 ¢/bu — a mild recovery from recent pressure. No fresh USDA crop data is due today; the move looks technical rather than driven by supply/demand news. The next significant data point will be the USDA's weekly crop progress report. Weather forecasts for the U.S. Corn Belt and Brazilian second-crop conditions remain the key variables to watch through June.
Relevant equities: Archer-Daniels-Midland (ADM), Bunge (BG), Corteva (CTVA), Nutrien (NTR).
Today's key macro event
8:30 AM ET — April PCE, personal income/spending, durable goods orders + Q1 GDP (2nd estimate)
This is the session's single biggest risk event. A PCE print above consensus would:
- Push yields higher and extend gold's decline
- Strengthen the dollar, adding pressure to copper
- Potentially signal that the Fed's "higher for longer" posture hardens into rate hike territory
A weaker-than-expected PCE would flip most of those signals. Traders expecting a bounce in gold or copper have this release as their key trigger.
Prices reflect live/near-live feed data as of publication. For investment decisions, verify against your data provider.
参考来源
- 1Kitco — Live Gold Price
- 2Investing.com — Real-Time Futures
- 3OilPrice.com — Futures & Indexes
- 4Kitco AM Report, May 27
- 5UBS lowers 2026 gold forecast to $5,500/oz
- 6Oil Prices Jump After Fresh U.S. Strikes on Iran
- 7US Crude, Gasoline Inventories Continue to Sink
- 8Three Oil and Two Gas Carriers Clear Hormuz
- 9Investing.com — Iron Ore 62% Fe CFR Futures
围绕这条内容继续补充观点或上下文。